Getting Started#
import pygrating as pg
Loading UVIT grating image using GratingImage#
The dispersion axis should be along the x axis of the image.
The file is assumed to be reduced using CCDLAB. If not, there could be errors while importing metadata.
file_name = 'data/HZ 4_FUV_Grating1.fits.gz'
image = pg.GratingImage(file_name)
HZ 4
    OBS_ID   = C03_013T01_9000001586
    DETECTOR = FUV
    FILTERID = Grating1
    RDCDTIME = 791.551 s
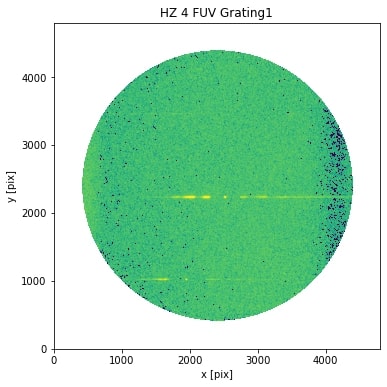
Plotting the image#
image.plot()
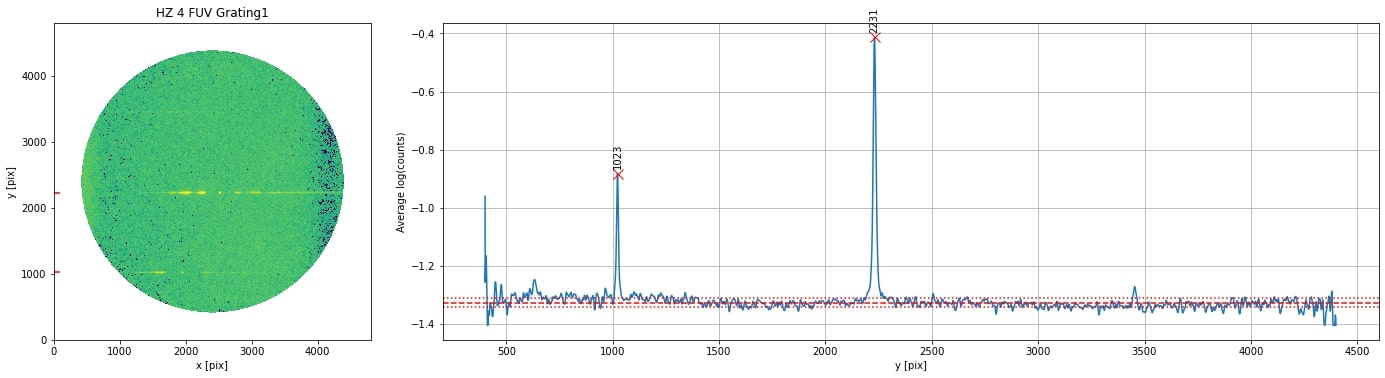
Identifying sources#
Detects sources by averaging across dispersion axis
Identifies peaks based on prominence
image.identify_sources(prominence=10)
C:UsersuserDocumentsworkM67_grism_spectrapygrating.py:130: RuntimeWarning: Mean of empty slice
  row_wise_counts   = np.log10(np.nanmean(self.data_smooth, axis=1))
WARNING: Input data contains invalid values (NaNs or infs), which were automatically clipped. [astropy.stats.sigma_clipping]
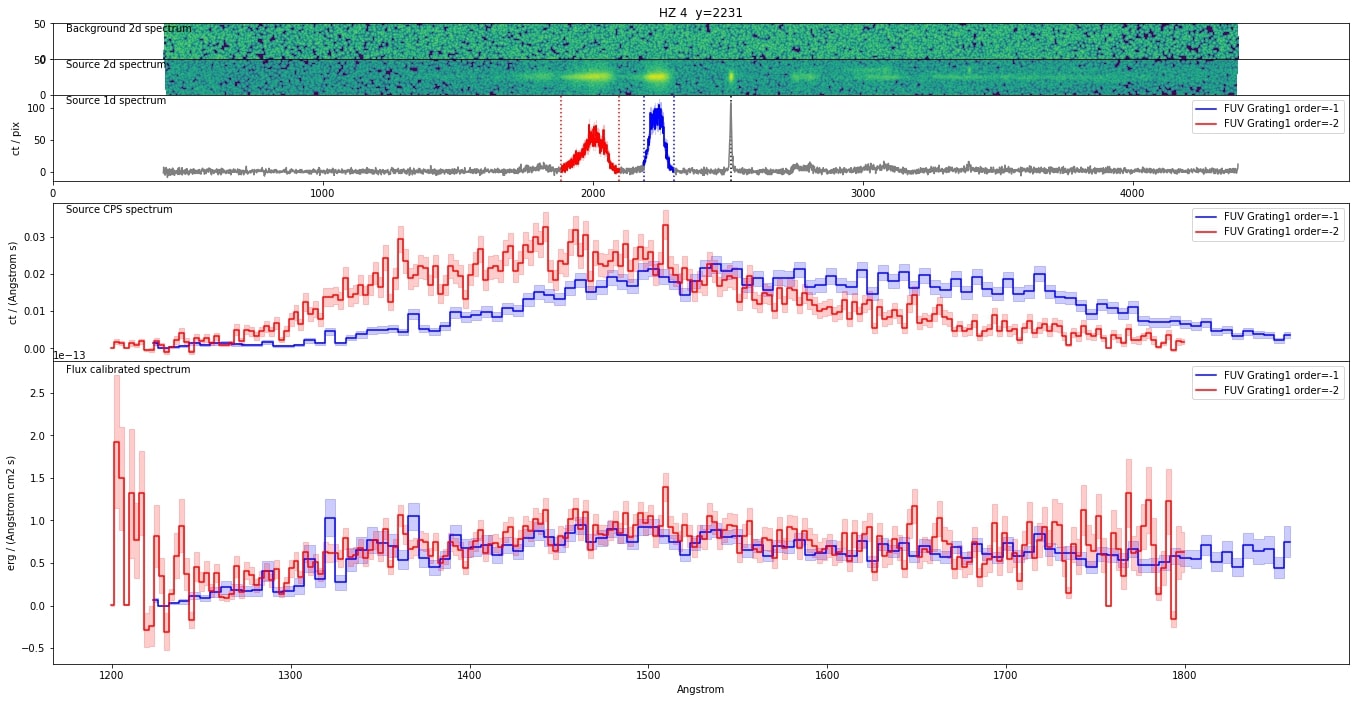
Spectra extraction using GratingSpectrum#
Minimum inputs are:
image : Gratingimage
ypix : y value of the source [pix]
upix_bkg : y value of the background region [pix]
Outputs
spectra of order -1 and -2 depending on the calibration status as follows:
FUV_Grating1 has order -1 and -2
FUV_Grating2 has order -2
NUV_Grating has order -1
source = pg.GratingSpectrum(image, YPIX=image.ypix_list[1], YPIX_bkg=2500,    # necessary
                         xpix=None, cross_disp_buffer=25)                  # optional
source.plot_all()
C:UsersuserDocumentsworkM67_grism_spectrapygrating.py:193: RuntimeWarning: divide by zero encountered in power
  self.fractional_error_Poisson = self.spec_1d.value**-0.5
(<Figure size 1440x720 with 10 Axes>,
 array([<Axes:title={'center':'HZ 4  y=2231'}>, <Axes:>,
        <Axes:xlabel='pix', ylabel='ct / pix'>,
        <Axes:xlabel='Angstrom', ylabel='ct / (Angstrom s)'>,
        <Axes:xlabel='Angstrom', ylabel='erg / (Angstrom cm2 s)'>],
       dtype=object))
Plotting individual spectrum#
pg.plot_spectrum(source.spectrum_m1)
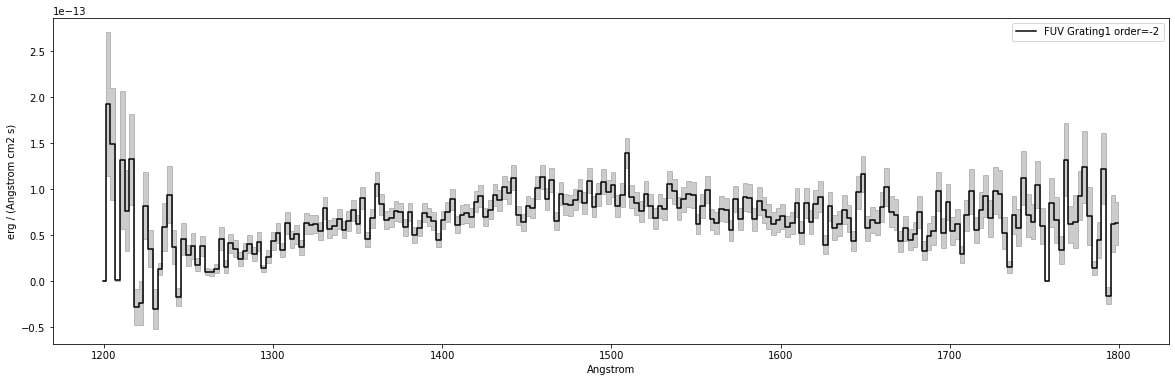
pg.plot_spectrum(source.spectrum_m2)
<AxesSubplot:xlabel='Angstrom', ylabel='erg / (Angstrom cm2 s)'>

Saving spectra and plots#
Spectra are saved as Astropy Qtables (which included units and errors)
source.save_all(folder_path='data/',overwrite=True)
Saved data/HZ 4_FUV_Grating1_2231_m1.fits
Saved data/HZ 4_FUV_Grating1_2231_m2.fits
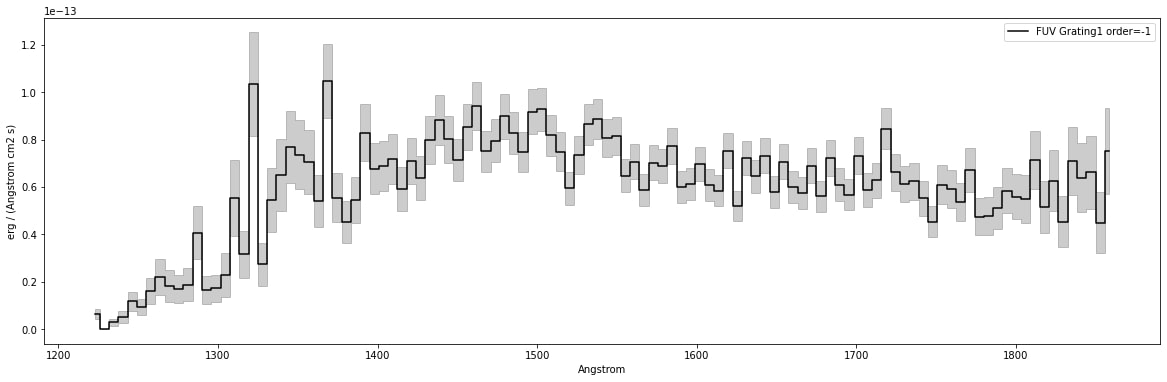
Loading and plotting saved spectrum#
spectrum = pg.load_spectrum('data/HZ 4_FUV_Grating1_2231_m1.fits')
spectrum
<Spectrum1D(flux=<Quantity [7.52920285e-14, 4.47650444e-14, 6.60952076e-14, 6.38335013e-14,
           7.08446397e-14, 4.53738511e-14, 6.26937331e-14, 5.16301974e-14,
           7.12793807e-14, 5.48660419e-14, 5.58522583e-14, 5.83373997e-14,
           5.10037209e-14, 4.76337872e-14, 4.74115547e-14, 6.69570061e-14,
           5.35336725e-14, 5.90936319e-14, 6.09934350e-14, 4.53699202e-14,
           5.51127881e-14, 6.23635606e-14, 6.13769598e-14, 6.61372424e-14,
           8.45924968e-14, 6.28622358e-14, 5.87547638e-14, 7.31085763e-14,
           5.67447570e-14, 6.08421076e-14, 7.22689964e-14, 5.59752019e-14,
           6.90222415e-14, 5.73515790e-14, 6.00576024e-14, 7.06072492e-14,
           5.78250684e-14, 7.31619440e-14, 6.44783523e-14, 7.21997678e-14,
           5.19543734e-14, 7.53509048e-14, 5.83412350e-14, 6.08994593e-14,
           6.96560377e-14, 6.13480470e-14, 6.00374668e-14, 7.72269965e-14,
           6.89142397e-14, 7.01827178e-14, 5.86401555e-14, 7.06522924e-14,
           6.47734488e-14, 8.14856583e-14, 8.07223061e-14, 8.86870147e-14,
           8.63647028e-14, 7.34582025e-14, 5.94052998e-14, 7.49056732e-14,
           8.18227460e-14, 9.27395326e-14, 9.18298061e-14, 7.49139484e-14,
           8.27520310e-14, 8.98024000e-14, 7.94011759e-14, 7.50318289e-14,
           9.41257007e-14, 8.52342914e-14, 7.14618409e-14, 8.00559019e-14,
           8.81003809e-14, 7.98038492e-14, 6.36583799e-14, 7.09554296e-14,
           5.92014304e-14, 7.17924640e-14, 6.89219214e-14, 6.75893638e-14,
           8.29692544e-14, 5.43288257e-14, 4.51946321e-14, 5.55155388e-14,
           1.04675787e-13, 5.39842444e-14, 7.04636101e-14, 7.35440985e-14,
           7.69159468e-14, 6.50911853e-14, 5.44863891e-14, 2.73930878e-14,
           1.03280223e-13, 3.16076227e-14, 5.53029459e-14, 2.28679427e-14,
           1.71809400e-14, 1.65688562e-14, 4.07314131e-14, 1.86850602e-14,
           1.67586194e-14, 1.82109793e-14, 2.18332378e-14, 1.60622901e-14,
           9.20376561e-15, 1.16549474e-14, 4.96316117e-15, 2.90266860e-15,
           1.28735313e-19, 6.24412455e-15] erg / (Angstrom cm2 s)>, spectral_axis=<SpectralAxis [1858.6882045, 1852.8550045, 1847.0218045, 1841.1886045, 1835.3554045,
   1829.5222045, 1823.6890045, 1817.8558045, 1812.0226045, 1806.1894045,
   1800.3562045, 1794.5230045, 1788.6898045, 1782.8566045, 1777.0234045,
   1771.1902045, 1765.3570045, 1759.5238045, 1753.6906045, 1747.8574045,
   1742.0242045, 1736.1910045, 1730.3578045, 1724.5246045, 1718.6914045,
   1712.8582045, 1707.0250045, 1701.1918045, 1695.3586045, 1689.5254045,
   1683.6922045, 1677.8590045, 1672.0258045, 1666.1926045, 1660.3594045,
   1654.5262045, 1648.6930045, 1642.8598045, 1637.0266045, 1631.1934045,
   1625.3602045, 1619.5270045, 1613.6938045, 1607.8606045, 1602.0274045,
   1596.1942045, 1590.3610045, 1584.5278045, 1578.6946045, 1572.8614045,
   1567.0282045, 1561.1950045, 1555.3618045, 1549.5286045, 1543.6954045,
   1537.8622045, 1532.0290045, 1526.1958045, 1520.3626045, 1514.5294045,
   1508.6962045, 1502.8630045, 1497.0298045, 1491.1966045, 1485.3634045,
   1479.5302045, 1473.6970045, 1467.8638045, 1462.0306045, 1456.1974045,
   1450.3642045, 1444.5310045, 1438.6978045, 1432.8646045, 1427.0314045,
   1421.1982045, 1415.3650045, 1409.5318045, 1403.6986045, 1397.8654045,
   1392.0322045, 1386.1990045, 1380.3658045, 1374.5326045, 1368.6994045,
   1362.8662045, 1357.0330045, 1351.1998045, 1345.3666045, 1339.5334045,
   1333.7002045, 1327.8670045, 1322.0338045, 1316.2006045, 1310.3674045,
   1304.5342045, 1298.7010045, 1292.8678045, 1287.0346045, 1281.2014045,
   1275.3682045, 1269.5350045, 1263.7018045, 1257.8686045, 1252.0354045,
   1246.2022045, 1240.3690045, 1234.5358045, 1228.7026045, 1222.8694045] Angstrom>, uncertainty=StdDevUncertainty([1.82012623e-14, 1.28798121e-14, 1.55136928e-14,
                   1.45804767e-14, 1.44075270e-14, 1.06598927e-14,
                   1.27427463e-14, 1.09629930e-14, 1.21796726e-14,
                   1.01477150e-14, 9.54346445e-15, 9.55971509e-15,
                   8.98211099e-15, 8.13429441e-15, 7.76614495e-15,
                   9.25695157e-15, 8.03937941e-15, 8.01847312e-15,
                   8.19751690e-15, 6.60253712e-15, 7.34547704e-15,
                   7.76842356e-15, 7.58482196e-15, 7.88024395e-15,
                   8.74665023e-15, 7.38417825e-15, 7.05605862e-15,
                   7.81764116e-15, 6.66454519e-15, 6.95587252e-15,
                   7.68193396e-15, 6.53331634e-15, 7.38072479e-15,
                   6.73665213e-15, 6.73641877e-15, 7.30316064e-15,
                   6.56983599e-15, 7.36918388e-15, 6.97330814e-15,
                   7.26985834e-15, 6.23672706e-15, 7.54805478e-15,
                   6.58439834e-15, 6.74128273e-15, 7.27925322e-15,
                   6.79353963e-15, 6.77777037e-15, 7.69270456e-15,
                   7.27928333e-15, 7.41571766e-15, 6.65837456e-15,
                   7.46255591e-15, 7.12638996e-15, 8.11480524e-15,
                   8.03837932e-15, 8.61657172e-15, 8.55739117e-15,
                   7.84160033e-15, 7.06602475e-15, 8.18745647e-15,
                   8.58682007e-15, 9.01427648e-15, 9.32734046e-15,
                   8.44748654e-15, 8.93396248e-15, 9.53195545e-15,
                   9.06886459e-15, 8.74369219e-15, 9.98095610e-15,
                   9.67481595e-15, 8.82206312e-15, 9.81015256e-15,
                   1.05612012e-14, 1.01636236e-14, 9.24342857e-15,
                   9.69546129e-15, 9.19414909e-15, 1.06416510e-14,
                   1.05777704e-14, 1.07642187e-14, 1.19208203e-14,
                   9.70813596e-15, 8.82008373e-15, 1.04349943e-14,
                   1.56974582e-14, 1.09594191e-14, 1.34848452e-14,
                   1.46367704e-14, 1.53034868e-14, 1.52652144e-14,
                   1.35416366e-14, 9.07952047e-15, 2.19328739e-14,
                   9.94838661e-15, 1.58994557e-14, 9.26682508e-15,
                   5.70330949e-15, 5.82083885e-15, 1.12688538e-14,
                   7.03362244e-15, 5.89341854e-15, 6.84282670e-15,
                   7.68638376e-15, 5.65321797e-15, 3.45861038e-15,
                   3.86639351e-15, 2.47152956e-15, 1.43867452e-15,
                   1.28171452e-19, 2.20091563e-15]))>
pg.plot_spectrum(spectrum)
<AxesSubplot:xlabel='Angstrom', ylabel='erg / (Angstrom cm2 s)'>